Get Ad-Free Access: Just $39/year

GM Reports Second Quarter Corvette Sales

While Quarterly Corvette Sales Are Down in 2018, the Decline Is Not Unexpected

As you may recall, GM announced that it was going to transition from monthly to quarterly reporting beginning in quarter two, 2018 We are pleased to present the first quarterly update since that transition.

Corvette Stingrays Bowling Green Kentucky
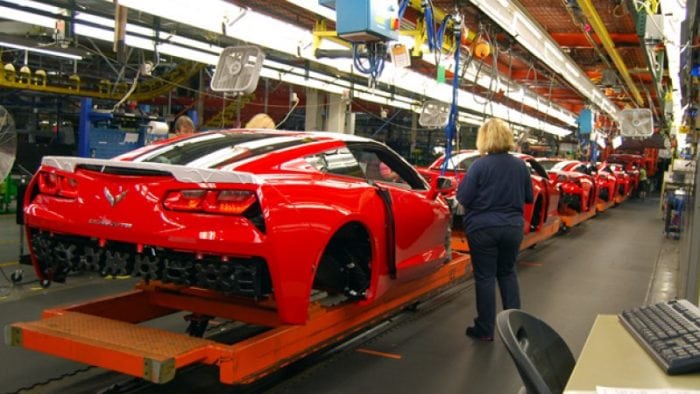
Corvette Stingrays at the GM Manufacturing Plant in Bowling Green, Kentucky.

Chevrolet reported that they sold a total of 5,785 Corvettes between April-June, 2018.  This is a sales decrease of 26.2% in total Corvette sales as compared to total units sold from April-June, 2017.

Since January, Chevrolet has sold a total of 10,242 Corvettes.  This is a sales decrease of 25.3% as compared to sales during the first-half of 2017, where Chevrolet sold a total of 13,707 Corvettes during that same period.

Corvette Transport Bowling Green Kentucky
Corvette Stingrays being transported from the GM Manufacturing Plant in Bowling Green, Kentucky.

It should be noted that these large sales decreases from 2017 to 2018 were expected by GM following the Corvette production changes that occurred after last summer’s plant renovations.

Perhaps one of the largest questions we’ve received related to the metrics behind Corvette sales is this – why the change in sales reporting – a quarterly update versus a a monthly update – by GM?

Per Kurt McNeil, General Motors U.S. Vice President of Sales Operations, the answer is pretty straight forward:

“Thirty days is not enough time to separate real sales trends from short-term fluctuations in a very dynamic, highly competitive market.  Reporting sales quarterly better aligns with our business, and the quality of information will make it easier to see how the business is performing.”

Here are the statistical numbers from GM’s Sales Report for Corvettes in the 2nd Quarter of 2018:

US Corvette Sales by Quarter with Totals

Year Q1 Q2 Q3 Q4 Yearly Total
2006 9,292 9,771 8,840 8,615 36,518
2007 8,176 8,904 8,091 7,836 33,007
2008 6,778 8,176 8,430 3,587 26,971
2009 3,052 4,446 3,297 3,139 13,934
2010 2,433 3,922 3,443 2,826 12,624
2011 2,839 4,057 3,374 2,894 13,164
2012 2,932 4,090 3,548 3,562 14,132
2013 2,941 2,732 2,157 9,461 17,291
2014 8,179 9,565 8,206 8,889 34,839
2015 8,517 9,790 8,091 6,931 33,329
2016 6,370 8,298 8,051 7,276 29,995
2017 5,804 7,903 5,184 6,188 25,079
2018 4,457 5,785 0 0 10,242