Get Ad-Free Access: Just $39/year

Corvette Sales Data – by Month & Quarter

corvette monthly and quarterly sales

Monthly & Quarterly Corvette Sales Numbers

Note: If you want annual sales numbers since 1953, check out Corvette Sales Volume by Year.

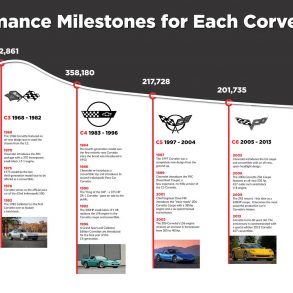
Earlier this month, Corvsport.com presented the sales statistics the most recent Corvette sales. We thought we’d take a moment to break down the sales numbers by month for the each generation.  For all Corvette owners (and prospective owners), these numbers are a key indicator of how the Corvette is performing in the marketplace.

Following Trends

Looking back to 2013, we noted a more dramatic shift in production numbers as Chevrolet wrapped up production of the sixth-generation Corvette and began production of the 2014 C7 model.  The decline in YOY (year-over-year) sales from 2012 to 2013 saw an average 36.8% drop is sales in May – September, 2013 (as compared to May – September, 2012.)  These numbers demonstrate that interest in the new model dramatically impacted sales of the outgoing Corvette model.

As we prepare for the 2023 model year to begin production, the big question that everyone is asking will be whether or not things are back to normal after Covid and supply chain disruptions over the last three years. 

Monthly Corvette Sales Numbers

Year Jan Feb Mar Apr May Jun Jul Aug Sep Oct Nov Dec
2005 2,382 2,365 3,215 3,177 3,078 2,417 1,872 2,202 2,372 2,981 3,157 3,271
2006 2,579 3,058 3,655 3,516 3,317 2,938 2,794 2,990 3,056 2,761 2,773 3,081
2007 2,234 2,784 3,158 3,227 3,300 3,055 2,377 2,877 2,837 2,484 2,438 2,914
2008 2,015 2,071 2,692 3,190 2,904 2,082 1,870 4,242 2,318 1,170 1,093 1,324
2009 842 1,027 1,183 1,407 1,643 1,396 966 746 1,585 1,154 952 1,033
2010 854 624 955 1,089 1,428 1,405 1,199 1,135 1,109 1,011 836 979
2011 721 955 1,163 1,454 1,304 1,299 1,291 936 1,147 946 910 1,038
2012 629 1,854 1,376 1,396 1,219 1,475 987 1,210 1,351 1,167 1,104 1,291
2013 908 980 1,053 974 905 853 671 655 831 3,929 2,527 3,005
2014 2,261 2,438 3,480 3,514 3,328 2,723 3,060 2,679 2,467 2,959 2,378 3,552
2015 2,127 2,605 3,785 3,469 3,514 2,807 2,794 2,725 2,572 2,526 1,952 2,453
2016 1,501 2,116 2,753 3,142 2,673 2,483 2,159 3,063 2,829 2,626 1,941 2,709
2017 1,263 2,081 2,460 2,756 2,535 2,612 1,930 1,748 1,506 1,345 2,565 2,278
2018 1,005 1,351 2,101 1,928 1,928 1,928 1,465 1,648 1,526 1,320 1,269 1,320
2019 1,297 1,245 1,401 1,881 2,171 1,736 1,568 1,756 1,442 1,149 1,193 1,149
2020 1,241 1,606 973 443 984 1,033 2,228 1,981 2,146 3,033 2,492 3,467
2021 2,116 2,116 2,380 2,692 2,588 2,692 3,431 3,304 3,431

Quarterly Corvette Sales Numbers

Year Q1 Q2 Q3 Q4 Total
2005 7,962 8,672 6,446 9,409 32,489
2006 9,292 9,771 8,840 8,615 36,518
2007 8,176 8,904 8,091 7,836 33,007
2008 6,778 8,176 8,430 3,587 26,971
2009 3,052 4,446 3,297 3,139 13,934
2010 2,433 3,922 3,443 2,826 12,624
2011 2,839 4,057 3,374 2,894 13,164
2012 2,932 4,090 3,548 3,562 14,132
2013 2,941 2,732 2,157 9,461 17,291
2014 8,179 9,565 8,206 8,889 34,839
2015 8,517 9,790 8,091 6,931 33,329
2016 6,370 8,298 8,051 7,276 29,995
2017 5,804 7,903 5,184 6,188 25,079
2018 4,457 5,785 4,639 3,909 18,790
2019 3,943 5,788 4,766 3,491 17,988
2020 3,820 2,460 6,355 7,671 20,306
2021 6,612 7,972 10,166 24,750